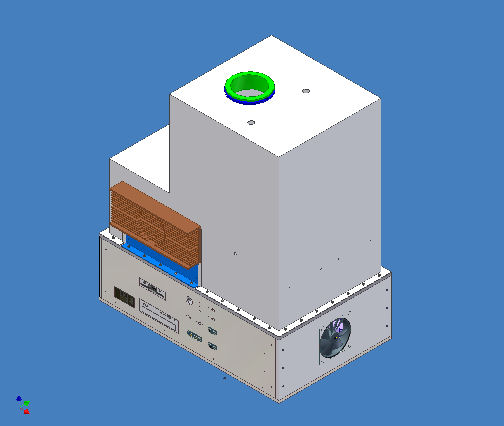
SPATRAM Full Description
SPATRAM Brief Description
SPATRAM is a multi-purpose UV-Vis-NIR spectrometer, ranging from 200 to 1060 nm It is installed at the Observatory of the Geophysics Centre of Evora (CGE), Evora, Portugal, since April 2004 and actually it is utilized to carry-out measurements of the zenith scattered radiation, the so-called "Passive mode", in order to retrieve - by application of DOAS (Differential Optical Absorption Spectroscopy) methodology - the vertical content of some atmospheric tracers such as Ozone, Nitrogen Dioxide, Bromine Monoxide, Formaldehyde and others.
Adding to SPATRAM the optical Alt-Azimuth platform (allowing for different geometry of measurements) called MIGE (Multiple Input Geometry Equipment) linked to the main body of the instrument by an optic fibre, the spectrometer could perform off-axis measurements of the sun scattered radiation in order to retrieve the atmospheric profiles of some gases having small absorbing potential of the radiation (the so-called 'optically thin' compounds) some of this compounds are: Formaldehyde, Sulphur Dioxide and BTX - Benzene, Toluene and Xilene. At the present we are study the possibility to use SPATRAM also for the detection of events of aerosol contamination. SPATRAM could perform measurements also in "Active mode", using a stabilized lamp as source of radiation. The measured spectral data will provide information on the content of some pollutants in the path of measurement. In other words, SPATRAM is an equipment for the air quality monitoring. In addition, it is foreseen to use SPATRAM for spectroscopy of the stars. The optical unit of the spectrometer is based on the GASCOD (Gas Analyzer Spectrometer Correlating Optical Differences) instrument that has been validated in two NDSC (Network for the Detection of the Stratospheric Changes) campaigns (Hofmann et al., 1995; Roscoe et al., 1999). The three available SPATRAM inputs (1 directly pointed to the zenith with a Field of View (FOV) of 1.1·10-5 sr, and 2 via optic fibres) consist in a series of flat and spherical mirror that focus the incoming radiation onto the entrance slit of the spectrometer. This is composed of a holographic spherical diffraction grating of 1200 grooves/mm An array CCD detector (1054x256 pixels, with 30x256 blind pixels used for the dark current quantification) produced by Marconi provides for the acquisition and conversion of the spectral signals The CCD is maintained at a constant temperature of -40°C in order to achieve the highest signal to noise ratio . The typical overall spectral resolution is about 0.5 nm. Band-pass filters are used to reduce the stray light inside the spectrometer. The integration time is automatically selected for each measurement and ranges from seconds at noon to a few minutes at twilight. An internal mercury lamp is used for periodic checks of the diffraction grating position, ensuring a spectral accuracy of better than 0.2 nm. The halogen internal lamp is devoted to the radiometric calibration and to check the linearity of the CCD sensor.
The DAS (Data Acquisition Software) running on the computer in the Electronic Control Units (ECU that is rigidly fixed under the Optical and Mechanical Unit - OMU) provides the management of the whole instrument. DAS allows for measurements in automatic and unattended mode according to the cycles defined in an ASCII files containing predefined keywords. DAS provides also to the storage of the measured spectral series (It is foreseen that DAS will be replaced with DANAS - Data Acquisition and aNAlysis Software - that will supply the application of the processing algorithms in order to obtain the results in real time). The spectrometer is contained in a thermo-insulated box which ensures constant temperature inside the instrument, avoiding changes in its optical characteristics (e.g. optical dispersion). The constancy of the working temperature is obtained by a PID (Proportional Integral Derivative) algorithm implemented in DAS.
The SPATRAM is connected to the net and it can be managed and controlled via TCP/IP by the authorized personal. In order to prevent any losses of spectral data (if the storage unit is damaged by an unexpected event), DAS provides also to the back-up of the data obtained during each day via FTP on a pre-selected FTP server, during the period of inactivity of the spectrometer. Usually during the night.
SPATRAM Full Description
This part of the of the DAS User Manual is from
- SPATRAM (Spectrometer for Atmospheric TRAcers Monitoring)
- OMU Optical Mechanical Unit
- ECU Electronic Control Unit
- SPATRAM Testing phase
- GASCOD vs SPATRAM
- Annex A1 GRATING PRINCIPLES
- References
SPATRAM (Spectrometer for Atmospheric TRAcers Monitoring)
The SPATRAM instrument has been developed by the collaboration between CGE-UE, ISAC-CNR and ENEA. SPATRAM is a multi-purpose UV-Vis-NIR spectrometer (200 - 1060 nm). It is installed at the Observatory of the CGE since April 2004 and actually it is utilized to carry-out measurements of the zenith scattered radiation, the so-called "Passive mode", in order to retrieve - by application of DOAS (Differential Optical Absorption Spectroscopy) methodology - the vertical content of some atmospheric tracers such as Ozone, Nitrogen Dioxide, Bromine Monoxide, Formaldehyde and others.
The "heart" of the SPATRAM (the monochromator, where the light is decomposed in its wavelengths) is based on the ones utilized in the GASCOD's type instrument [63] - [65]. GASCOD (Gas Analyzer Spectrometer Correlating Optical Differences) is a family of spectrometers developed at the ISAC institute in the last 15 years. Since the study of feasibility for the SPATRAM equipment started with the analysis of the GASCOD installed at Terra Nova Bay Station, a very brief description of the forefather of the developed instrument has to be done. The equipment consists of a 150 cm -f/5- Cassegrain telescope that focuses the incoming radiation onto the entrance slit of the spectrometer. This comprises a holographic spherical diffraction grating of 1200 grooves/mm and a multichannel detector featuring a 512 metal-oxide semiconductor diode array by Hamamatsu. The spectral dispersion is 2.4 nm/mm and the overall typical spectral resolution of about 0.5 nm. Figure 5.2 show the GASCOD3/3 installed at the Italian Antarctic Station since 1995 ( 66).
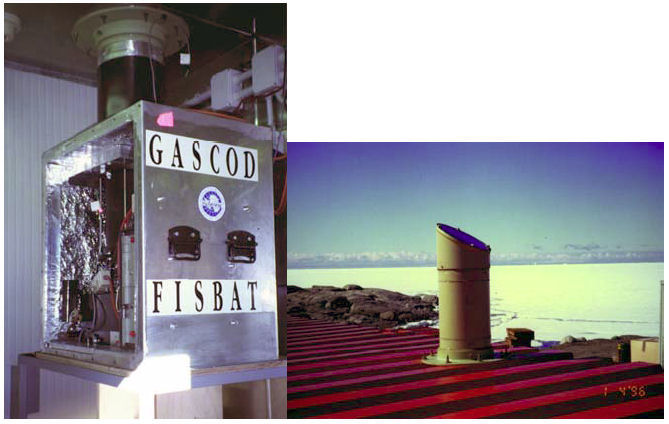
The optical design of the monochromator (entrance slit, grating and grating mount) is the only common feature of the two instruments. The main differences between the 2 instruments are found in the optical mount for the input radiation and in the use of a CCD Camera as detector instead of the CMOS utilized in the GASCOD. Furthermore, for the management of the SPATRAM, both the electronic unit as well as the software for the data acquisition were completely improved.
Since the physical principles of the grating are out of the scope of this doctorial work, but being the optic design and the grating mounts of the spectrometer monochromator of primary importance for a better understanding of the physics behind this optical instruments, Annex 1 includes the detailed explanation of the gratings laws.
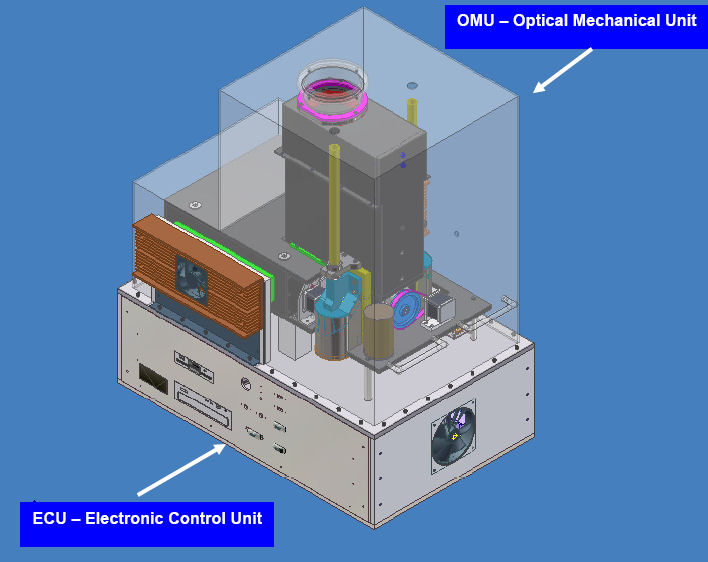
The spectrometer is installed inside a thermostatic box able to keep the internal temperature within the working range of the instrument (typically 15°C for the Optical Mechanical Unit). The Electronic Control Unit (ECU), equipped with 1GHz CPU, drives the spectrometer in automatic and unattended mode as per predefined measurements cycle;
In the following paragraphs the structure and the components of the equipment will be presented and discussed in details.
OMU Optical Mechanical Unit
In figure 2 the Optical Mechanical Unit is shown.
Some of the components are highlighted:
- The primary input for the radiation (also called Optic Tower)
- The optic fiber inputs
- The rotating mirror module for the selection of the desired input
- The monochromator where the incoming radiation is dispersed
- The ventilated box containing the CCD sensor
- The modules for the thermoregulation of the OMU
- The interface between OMU and ECU
- The switching power supply for the mercury calibration lamp
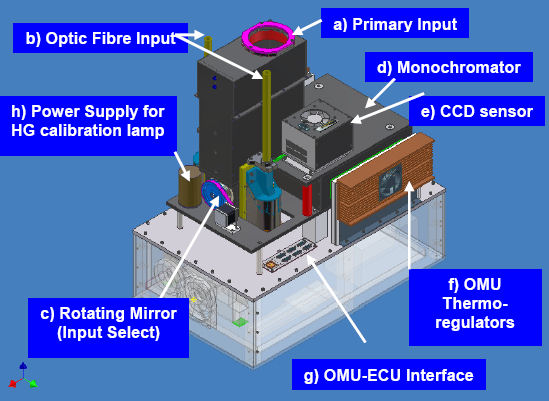 Figure 2 - Main modules in the Optical Mechanical Unit of the SPATRAM instrument
Primary Input
The Primary Input (Figure 3) is the default optic channel for the DOAS measurements carried out by the spectrometer. The light enter the instrument passing trough the quartz window (a). The light beam is reflected by the tilted flat mirror (b) over the spherical mirror (c) that focus the radiation on the input (d) of the rotating mirror module. The quartz window is placed in order to protect the optic parts contained in the optic tower. Moreover the features of transparency to the UV radiation of the fused silica allow the measurements of a wide spectral range (starting from 300 nm). If a normal glass has been utilized it should be impossible to have measurements above the 400 nm.
Instead of the classic Cassegrain telescope used in similar equipment, the "Optic Tower" described was preferred, mainly for the low cost of realization, for the simple installation and also for the relatively simplicity in the optical alignment.
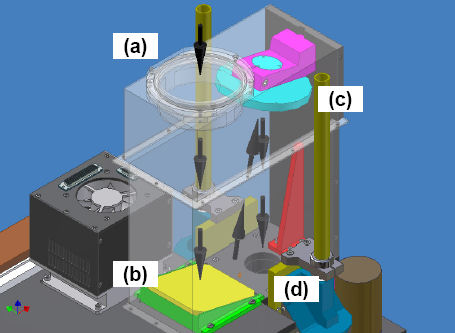
The SPATRAM was not developed for routinely operations at the exterior, so an optical chimney, installed of the roof of the room\lab where the instrument works, could be provided to protect the whole equipment from the atmospheric conditions.
Optic fibers input
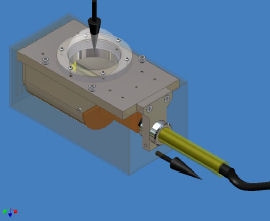
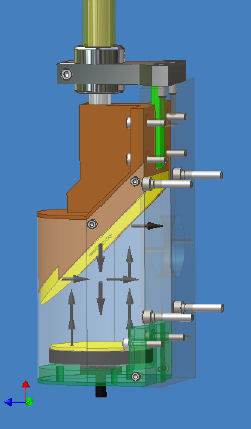
The instrument is provided with two inputs via optic fibers allowing for measurements in other geometric configurations depending on the type of the incoming device. These inputs are also useful when the primary input can not be used for direct measurements i.e. when the optic chimney is not available)/n
Rotating Mirror module
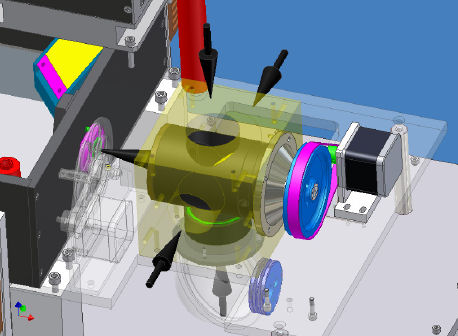
With a stepper motor that provide the desired position, the flat mirror tilted at 45° addresses the light beam, coming from one of the four available inputs, towards the entrance slit of the monochromator .
- The four inputs are:
- the vertical one (for measurements with the Primary Input)
- the left and right ones (for measurements with the two Optic Fibers Inputs)
- the lower one (for spectral or radiometric calibrations - see next paragraph)
Calibration sphere and HG Calibration lamp's Power Supply
The calibration sphere contains one low pressure mercury lamp that is a useful means of calibrating the spectra in wavelength, and one halogen light source that produces an intense continuum spectrum from 400 nm to 2 microns used for radiometric calibration of the measured solar spectra.
Filters wheel
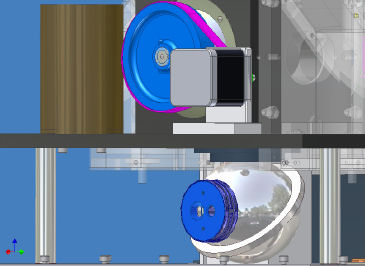
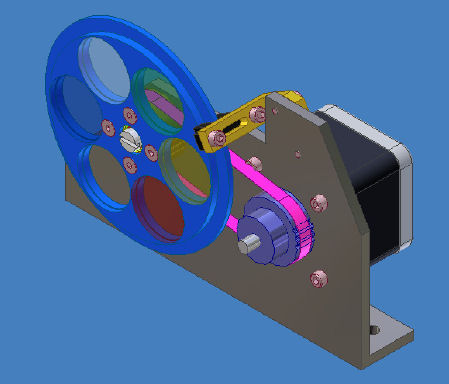
The Filter Wheel contains a set of band-pass filters (4) that have to be used in the different spectral intervals scanned by the SPATRAM, in order to select only the radiation belonging at the actual range of wavelengths. One Neutral density filter is also mounted in. A band-pass filter has a transmission band surrounded by two blocking bands that allow only a portion of the spectrum to pass. These filters have broad spectral bandwidths in either the ultraviolet, visible, or infrared spectrums. The nearly black filters absorb visible radiation. They are perfect for ultraviolet or infrared detection applications. Neutral Density (ND) filters appear gray in color and reduce the amount of light reaching the CCD camera. Since the transmission value only varies over a small percent in the visible, there is no effect on color balance. Instead of just stopping down the lens aperture due to high light levels, ND filters allow for wider apertures which can be used to decrease the depth of field. This allows the important information to be separated from the background. Compared to polarizing filters, ND filters are ideal for overall light reduction in cases of extreme light intensity. By stacking filters, it is possible to achieve other Optical Density (OD) values. All mounted filters can be threaded together with identical male and female threads on each mount. Optical Density exhibits an additive relationship; for example, stacking filters with OD values of 0.6 and 0.9 yields a resultant density of 1.5. The optical density is related to the transmission by the following equation: T = 10-D x 100 = percent transmission.
Thermoregulation modules
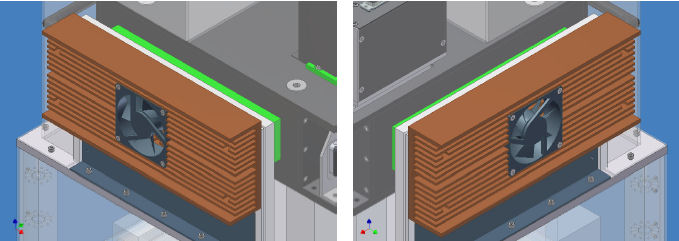
The 2 thermoregulation modules (each composed by 4 Peltier plates) allow for the maintenance of a constant temperature inside the monochromator (tipically 15°) , in order to prevent variations in the dispersion parameters of the grating due to mechanical deformations caused by the variation of the inside temperature. Thanks to their unique heat and operational characteristics, Peltier modules allow to reach the required cooling without huge technical problems and finance expenditure. They are quite compact, convenient, reliable and efficient.
There used a so called thermoelectric refrigerator based on Peltier effect. The given effect was called after a French watchmaker (1785-1845.), who discovered it in 1834.
If you put a drop of water in the hollow on the joint of 2 semiconductors Sb and Bi, and switch on the current, the drop would freeze (with the reverse direction of the current the drop would melt). This is how Peltier effect works.
Unlike the Joule heat which is proportional to the current strength squared (Q=R·I·I·t), the Peltier is proportional to the current strength and changes the sign (-/+) if the current changes the direction.
The Peltier heat equals:
![\[ Qp = P·q \]](form_73.png)
q=I·t, P is a Peltier factor that depends on contacting materials and temperature.
Peltier heat is considered positive in case of dissipation, and negative in case of absorption.
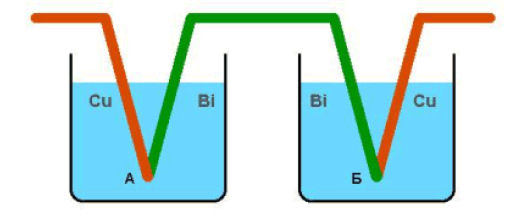
In this case the Joule heat in both calorimeters is the same (since R = R(Cu)+R(Bi)).
But the Peltier heat differs in the sign. So, this experiment allows to calculate the Peltier factor.
In the table below you can see some Peltier factors for different pairs of metals.

Usually, a Peltier factor is calculated this way: P = a · T
- P - Peltier factor,
- a - Tomson factor,
- T - absolute temperature.
In theory, the Peltier effect is explained the following way: electrons speed up or slow down under the influence of contact potential difference. In the first case the kinetic energy of the electrons increases, and then, turns into heat. In the second case the kinetic energy decreases and the joint temperature falls down. In case of usage of semiconductors of p- and n- types the effect becomes more vivid. On the scheme you can see how it works.Combination of many pairs of p- and n-semiconductors allows to create cooling units - Peltier modules of relatively high power (see the scheme below).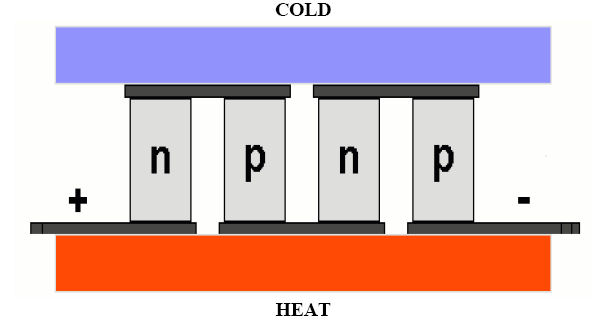 Figure 11 - Usage of semiconductors of p- and n-type in thermoelectric coolersA Peltier module consists of semiconductors mounted successively, which form p-n- and n-p-junctions. Each junction has a thermal contact with radiators. When switching on the current of the definite polarity, there forms a temperature difference between the radiators: one of them warms up and works as a heatsink, the other works as a refrigerator.
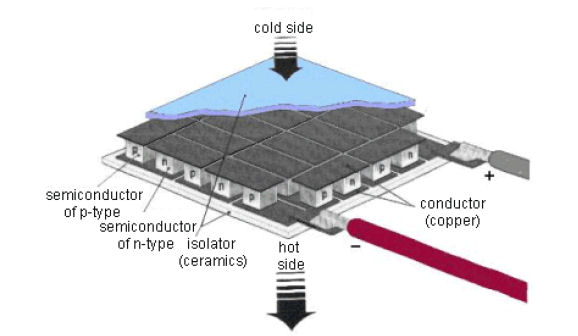 Figure 12 - Structure of a Peltier moduleA typical module provides a temperature difference of several tens degrees Celsius. With forced cooling of the hot radiator, the second one can reach the temperatures below 0 Celsius. For more temperature difference the cascade connection is used.
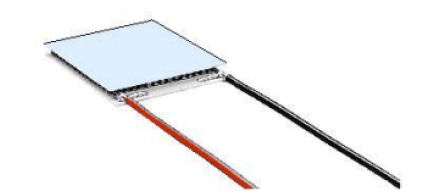 Figure 13 - Peltier moduleThe cooling devices based on Peltier modules are often called active Peltier refrigerators or Peltier coolers. Peltier module's power depends on its size. The modules of low power might not be efficient enough. But the usage of the modules of too high power might cause moisture condensation, what is dangerous for electronic circuits.
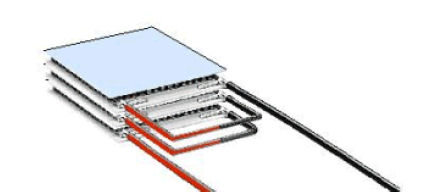 Figure 14 - An examble of cascade connection of Peltier modules
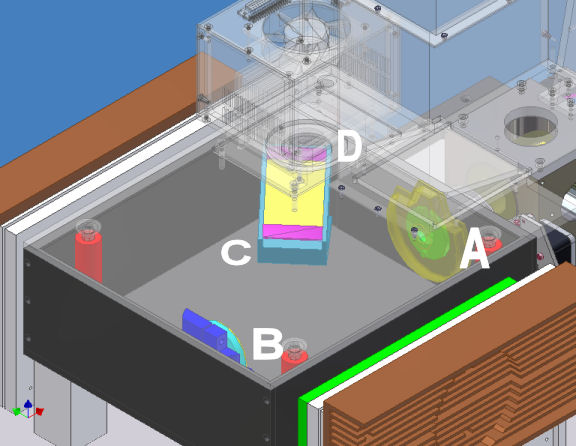
Monochromator
The monochromator is the heart of the instrument. Here the light bundle, focused by the entrance slit (a), is decomposed in its wavelengths thanks to a holographic diffraction grating (b) of 1200 grooves/mm and 70mm of diameter. The grating is by Jobin-Yvon and has a dispersion of 2.4nm/mm at 300nm and spectral resolution of 0.5 nm at 430 nm. The grating with its support is rotated by means of a stepper motors in order to investigate, in following spectral windows of about 60nm each, the whole spectral range from 250 to 1050 nm. The decomposed light is addressed over a tilted mirror (c) that reflect the information to the CCD sensor (d).
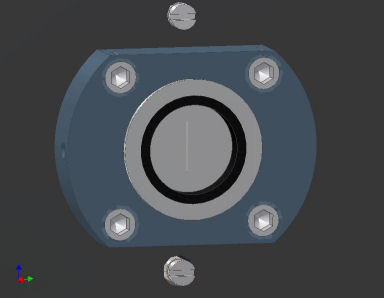
Slit
The input slit of the spectrometer (obtained for photogravure on a covered quartz disc of 14 mm of diameter and 1 of thickness) is wide 150 micron and 8 mm of height, that it is equivalent to the vertical dimension of the CCD sensor.
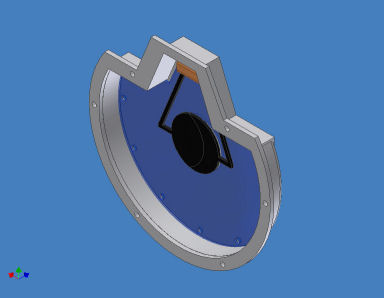
Shutter
The UNIBLITZ® VS14 and VS25 shutter series have been designed to give accurate, repeatable exposures for a wide variety of applications. They have been successfully field tested in microscopy, video imaging, PMT protection, and photographic applications worldwide. Available with either 14mm or 25mm apertures, these shutters are offered in either cased or uncased configurations. The uncased shutter allows a high degree of flexibility when mounting the unit in OEM applications. The cased version of this series is very popular due to the protection the black anodized aluminum housing provides the precision shutter mechanism. When used with laser or high energy non-coherent light sources, alternate reflective blade coatings and finishes are available.
The diffraction Grating
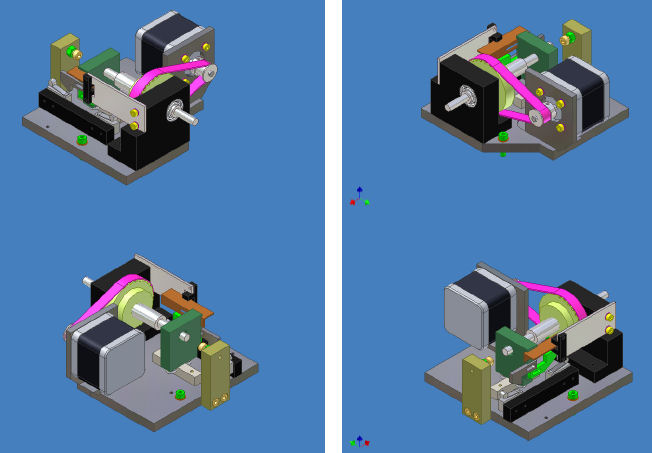
SPATRAM is equipped with an holographic spherical diffraction grating (Figure 5.19) of 1200 grooves/mm in a particular constant deviation mount allowing for a spectral dispersion of 2.4 nm/mm and the overall typical spectral resolution of about 0.5 nm in the UV region; in the visible spectral region the spectral resolution is a little bit worse (0.7 nm), and in the NIR region is about 1.2 nm. The full spectral interval covered by the SPATRAM ranges from 250 to 950 nm.
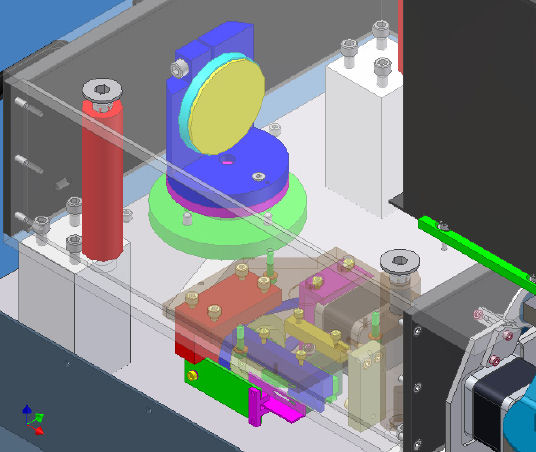
Due to the need to maintain the monocromator dimension small and due to the optical features of the CCD sensor, the full spectral range covered by the instrument can not be obtained with a single scan, but (as in § A1.1.17, applying a modified (A1.45)) with a rotation of the grating allowing for the analysis of the spectrum in successive windows of approximately 60 nm each. In order to reach this result, trying also to minimize the risk of degrading the spectra, a mechanism based on a micrometric screw allowing for positioning the grating was developed (Figure 5.20). This system has a precision in the movement of 0.05 nm, thanks to a mechanical reduction of ¼ , and a ratio of 1/256000 round/step in the stepper motor used to rotate the screw. An optoelectronic switch is used for the reference position and it can be adjusted in order to obtain the maximum performances of the grating. Two more electric switches are utilized to mark the limits of the useful mechanical path. All these devices are continuously monitored during the execution of the measurements minimizing the risk of wrong positioning of the grating.
Mirror tilted 45º
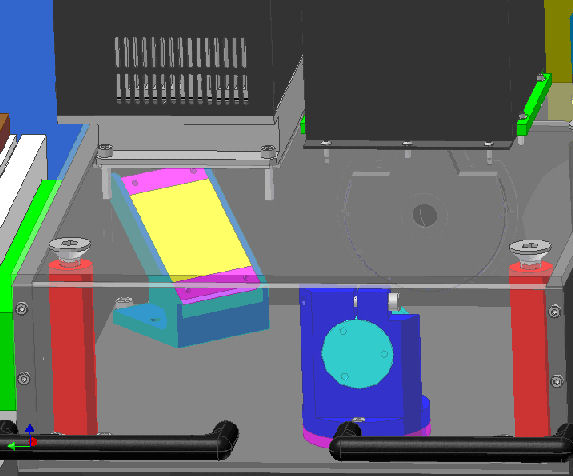
The flat mirror tilted at 45° send the diffracted light beam to the CCD sensor. In order to take into account the astigmatism of the Rowland circle mounting (see § A1.1.15), the mirror is rotated towards the left of 0.6°. In fact, if the mirror is perpendicular to the tangential plane of the grating, the borders of the spectrum should be always defocused. In this manner more than 90% of the spectrum reaching the CCD sensor has the same focusing. In the previous instrument like the GASCOD, the quality of the mounting and of the focusing could be checked only in a qualitative way during the alignment of the grating, since both the detector and the software for the data acquisition, were not developed for this purpose. With SPATRAM it is possible to have the instantaneous visualization of the acquired spectrum of a calibration lamp and in addition, thanks to the array CCD detector utilized, the mirror can be exactly positioned for the best focusing.
CCD Sensor
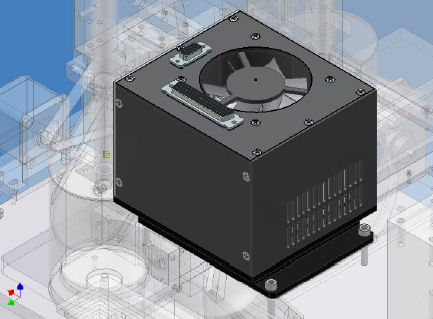
The CCD camera is composed of the exterior box containing the 16 bits AD Converter, the adapter for the transmission of the digitized signal to the PC, the Peltier device for the thermoregulation of the CCD sensor and the fan for the refrigeration of the whole device. The CCD sensor (mod. CCD30-11Bi, manufactured by Marconi) is contained in a small ultra vacuum chamber allowing for the maintenance of the temperature at -40°C.
Due to the importance assumed by the CCD device in this last years, in Annex 2 the main features of this kind of sensor are presented and the specific terms - the Glossary - of the CCD are explained. In the following the main distinctive aspects of the detector adopted in the SPATRAM instrument are discussed.
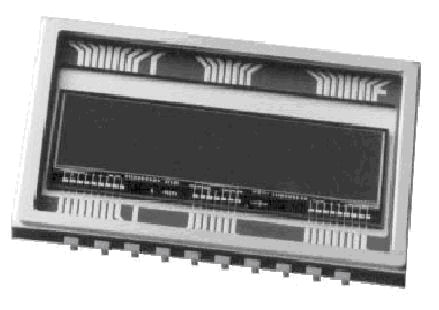
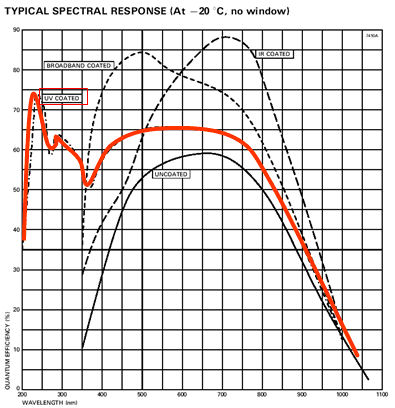
The back illuminated CCD30-11 (Figure 5.23) is a high performance CCD sensor designed for use in the scientific spectroscopy instrument , where enhanced quantum efficiency is required. With an array of 1024x256, 26 mm square pixels it has an imaging area to suit most spectrometer outputs of 26.6 x 6.7 mm. The back illuminated CCD30-11 has a Quantum Efficiency (see § A2.2.4) enhanced and an ultraviolet coating making it perfect for measurements in the UV-Visible spectral region (Figure 5.24) The signals degrade in the IR, but until 950nm the measurements are profitable. The readout register is organized along the long (1024 pixel) edge of the sensor and contains an anti-blooming drain to allow high speed binning operations of low level signals which may be adjacent to much stronger signals. The output amplifier design has no light emission.
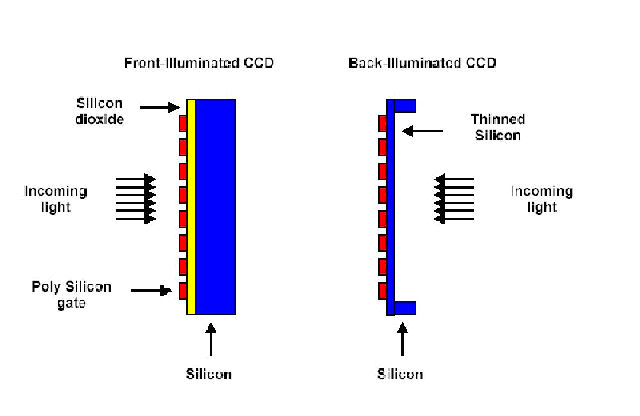
The main advantage in using a back illuminated CCD has to be found in the higher Full Well Capacity (almost the double) of this type of sensor compared with the equivalent Front Illuminated ones; the CCD30-11Bi has a FWC of 500000 e-, against the 300000e- of the CCD30-11Fi. This difference is mainly due to the construction technology of the 2 types of sensors. Figure 24 shows the two basic ways CCD chips are constructed. On the left, is a front-illuminated chip. Here, the incoming light strikes the gates. These are the tiny blocks on the SiO2 insulation layer that are required for creating the charge that allows the device to convert photons into electrons. The problem is the photons must pass through these gates before they can be converted to electrons. The gates act as a mask, particularly in the blue regions where they are often opaque. On the right is a back-illuminated chip. While the light must pass through the substrate, the substrate is usually much thinner than for the front-illuminated chip. The main point, however, is that the photons do not have to pass through the gates. The back-illuminated chip is more sensitive than the front-illuminated chip. This is quite apparent in the figure where the back-illuminated chip has a much high quantum efficiency, i.e., more of the photons that hit the chip are converted to electrons.
Other OMU Components
In this section some other mechanical and electrical components in the OMU will be listed (with the used acronyms) and briefly described:
- SM1 - Stepper Motor for the movement of the input mirror. It has also a reference opto-switch (D1) correspondent to the "Vertical" position of the input mirror.
- SM2 - Stepper motor for movement of the grating reticulum. It is equipped also of an opto-switch (D2) fixing the reference position at 4358A, and 2 electric switch fixing the mechanical limits
- SM3 - Stepper motor for the filter wheel with the reference opto-switch (D3) corresponding to the "hole" position (no filters)
- HGL - Mercury lamp for spectral calibrations (12 V DC, 6W)
- QJL - Halogen lamp for radiometric calibration
- probes of temperature (6)
ECU Electronic Control Unit
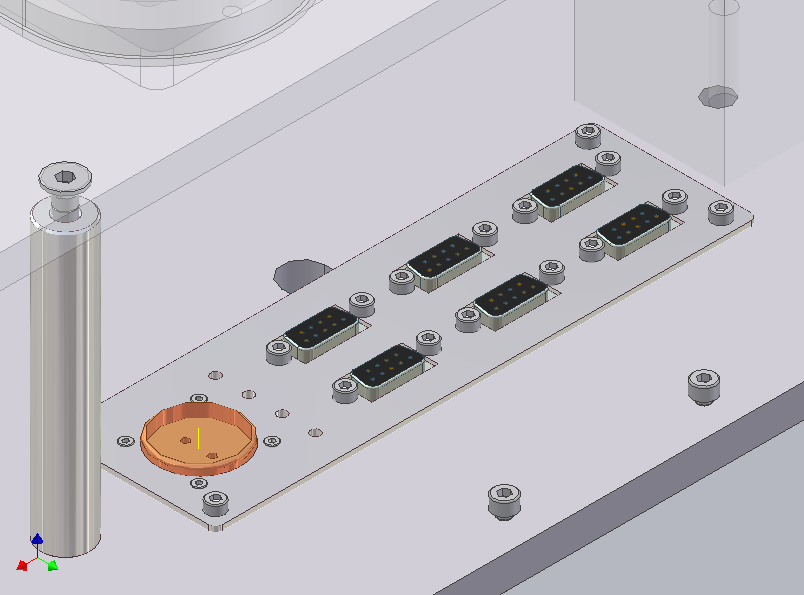
The Electronic Control Unit (ECU) (Figure 25)is located under the OMU to which it is connected with some D-Sub connectors placed in the panel called the OMU-ECU interface (Figure 26).
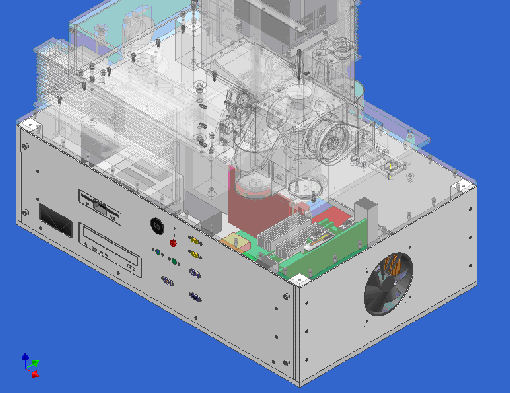
The ECU at the exterior seems like a normal personal computer; in fact in the front (Figure 27) can be recognized:
- the power button,
- the floppy drive,
- the CD-ROM drive,
- the net plug.
- 2 status led and the reset button,
- the PS2 keyboard and mouse ports
- the parallel ports,
- 2 USB ports,
- the serial port
- the VGA connector, Inside the ECU (Figure 28) can be identified:
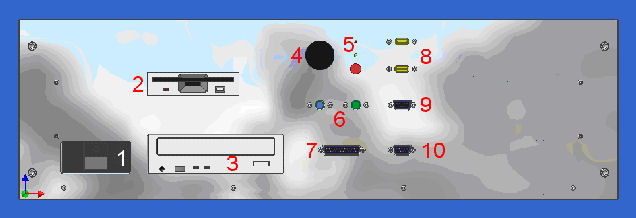 Figure 27 - ECU Front
 - the 7892 NOVA Monoboard with 1 GHz CPU
- the PCI interface adapter (FDL)
- the HIRES device for the management of the CCD Camera (with the low noise power supply) (dclrefman);
- the 12 bit AD Converter. DIAMOND installed on the bus PC 104 of the NOVA monoboard, for the AD590 temperature sensors spread in the OMU and in the ECU;
- the two stepper motors controllers (the AMS2 (Advanced Micro Stepping) Controller), connected to the NOVA trough the COM1 serial port. The AMSs drive the 3 stepper motors in the OMU. In addition one AMS provides the generation of a square wave for the thermoregulation of the entire OMU;
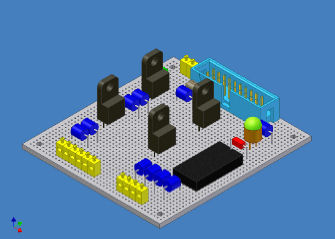
- the TAD (Temperature Adapter Device) acting as a current/tension converter of the signals furnished by the AD590 Temperature sensors. The output of the TAD is the input of the DIAMOND Converter;
- the ROI (Relais Opto Interface) for the control of the relais via the opto insulate decoupled ports of the AMS device.
- the 12/24V Power Supply
- the NOVA Power Supply
- the 4 relais for: Peltier Heat/Cool, Fan Peltier, HG and QJ spectral Lamps On/Off
- the fuses acting as a circuit protection
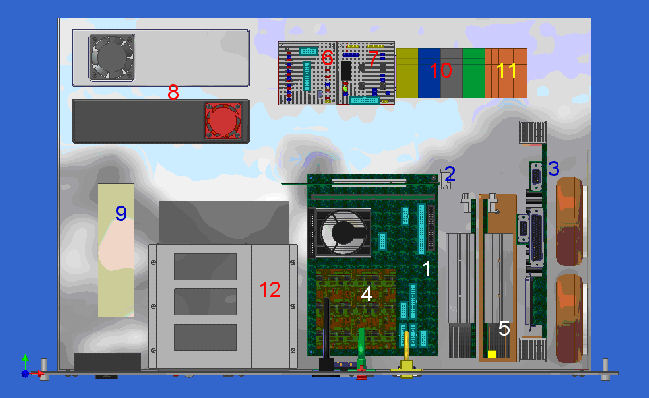 Figure 28 - ECU TopFigure 29 - ROI" \image html Fig4_41.jpg ""Figure 30 - TAD"
SPATRAM Testing phase
As a first check of the capabilities of the SPATRAM, the Fraunhofer's spectral lines in the solar spectrum can be considered and identified.
In 1802, William Wollaston observed for the first time the spectral lines. Only in 1814 their systematic study begun, when the German optical Joseph von Fraunhofer observed and catalogued the spectral lines. Fraunhofer accurately recorded the position of the lines. Figure 31 shows the well known spectrum of the visible light and some dark lines (listed also in Table 3) are clearly visible. The colored spectral lines produce the emission spectrum, meaning that one photon is emitted by an atom at a particular frequency. The dark spectral lines are instead the absorption lines creating the absorption spectrum, that means: photons with particular wavelengths are absorbed by the medium. Figure 31 - Electromagnetic visible spectrum. The Fraunhofer lines are highlighted Table 3 - Fraunhofer's lines with the corrispondent chemical elements and the wavelength. The SPATRAM operates from 250 nm to 950nm in successive windows of 60 nm each, and the main features of the solar spectrum can be identified.
Figure 32 shows the solar spectrum obtained with the SPATRAM in the 300.9-364.3 nm spectral range. Figure 32 - "SPATRAM - Scattered solar radiation in the 300.9 - 364.3 nm spectral range.
The quite absolute absorption of radiation lower than 300 nm has to be noted." This spectral region is still in the far UV, therefore there are no correspondences with the lines reported in table 5.7. It has to be notice that for wavelength lower than 300nm, the solar radiation is quite totally absorbed by the ozone layer in the stratosphere. This spectral region is particularly useful for the determination of the columnar content of ozone (as already mentioned in chapter 3).
Figure 33 shows a measurement obtained in the 353.0 - 415.4 nm spectral range. The Fraunhofer's lines codified as K (393.4 nm) and H (396.8 nm) and due to the absorption by the Calcium. Also this spectral window can be utilized for the retrieval of the ozone slant column even if its absorption for this frequency is lower than in the previous spectral range collected by SPATRAM. Moreover in this window others tracers (as SO2, BrO, HCHO) have absorption features that can be exploited for their slant column determination. Figure 33 - "SPATRAM - Scattered solar radiation in the 353.0 - 415.4 nm spectral range. " Figure 34 plots the 405.2 - 465.6 nm spectral range and the following spectral lines can be identified
- h - due to absorption of hydrogen at 410.2 nm
- g - due to absorption of calcium at 422.7 nm
- G - due to absorption of Iron and Calcium at 430.8 nm
- e - due to absorption of Iron at 438.4 nm This spectral window is the best for the retrieval of information about the atmospheric content of nitrogen dioxide, since it is in this region that the NO2 shows the greater absorption Figure 34 - SPATRAM - Scattered solar radiation in the 405.2 - 465.6 nm spectral range.
GASCOD vs SPATRAM
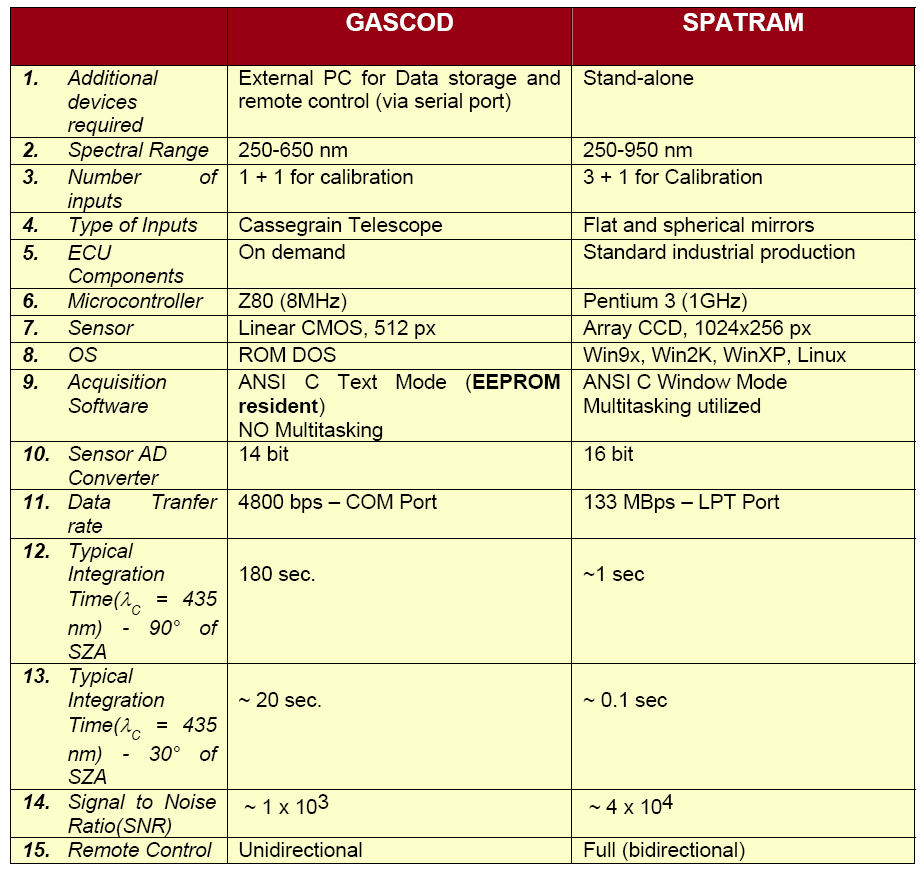
The main objective of this work was the development and realization of a new equipment (the SPATRAM), based on the optic module of the "old" GASCOD spectrometer, allowing for the retrieval of minor compounds in the atmosphere, with improved temporal resolution, flexible management and enhanced capability of measurements. Table 5.4 summarizes the most important improvements of the SPATRAM.
First of all, it has to be noted (record 1) that the SPATRAM is a stand alone instrument: it doesn't require any other device in order to perform and store reliable spectral measurements. On the contrary, GASCOD needs to be installed into a thermostatic box, where the temperature is controlled with an air conditioner installed outside the case, and in addition an external PC is also required for the data storage and the remote control of the instrument (in unidirectional mode -record 15). Furthermore SPATRAM is an all-in-one instrument meaning that the optic and electronic unit, even if thermal separated, are collocated in the same box; instead GASCOD presents two different unit linked with a series of cables. Record 2 of table 5.4 highlights that SPATRAM cover a wider spectral range than GASCOD, allowing for the detection of a great number of compounds (all that species with marked absorption features in the investigated spectral range). Record 3 and 4 specify the increased number of inputs of the SPATRAM instrument (3 + 1, for the spectral and radiometric calibration) and the focusing optic system adopted. SPATRAM use a series of flat and spherical mirrors coupled with a rotating flat mirror that are more easy to align and also more economical than the cassegrain telescope used in the GASCOD spectrometer. Records 5 to 11 summarize the improvements in the electronic modules adopted: first of all, the ECU components of the SPATRAM are of standard production and easily replaceable in case of failure. The GASCOD devices are the results of a deep study conducted during the eighties at the ISAC institute, in order to reduce the electric and electronic noises related to the adopted devices. Unfortunately these studies had not conducted to an industrial production of the electronic components so the life of the instruments is linked to the life of the electronic devices. The use of one microcontroller of the last generation with a frequency of 3 order of magnitude higher than the Z80, allows for obtaining performance incredibly superior than the GASCOD. The main difference in using a CCD detector instead of a CMOS sensor (record 7) are already discussed above. The selection of one standard operating system as Win9x, Win2K/Xp or even Linux (as stated in record 8), is related to the project of a full compatible system. The DOS resident on the Read Only Memory (ROM) of the GASCOD spectrometer does not allow for multitasking operations as is possible to obtain with the currents operating systems based on the object programming and windows philosophy. In addition (record 9) the adoption of a standard programming language (as it is the C/C++) allows for the on line modification of the Data Acquisition Software (DAS) and the possibility to add new functions and modules in a short time. The GASCOD's DAS, is placed on one EEPROM (Electrically Erasable Read Only Memory), and in order to modify the DAS the EEPROM has to be removed from the device and placed on the EEPROM programmer for placing the new compiled code in it. The compiled code is obtained with a compiler in a different computer. Record 10 highlights the improvement from 14 to 16 bits of the AD converter for the CCD sensor in GASCOD and SPATRAM respectively. This means that for GASCOD the maximum amplitude of the signal can be of 16384 counts instead for SPATRAM is 65536. Record 11 shows the enhancement in the transfer rate of the measured data (from 4800 bps to 133MBps). Records 12 and 13 demonstrate the improvement in terms of time resolution in the measurements of SPATRAM, since at the same wavelength the exposure time for SPATRAM is about 3 order of magnitude lower than for GASCOD. Finally, record 14 emphasize the higher signal to noise ratio (SNR) of the measurements obtained with SPATRAM (~ 4 x 10+4) than the ones taken with GASCOD (~ 1 x 10+3). The value of the SNR is obtained applying the equation 5.1.
(5.1)
where: B = vertical binning, S = the stray light inside the spectrometer (photons/pixel/second), P = incident photon flux (photons/pixel/second), Qe = CCD quantum efficiency, t = integration time (seconds), D = dark current value (electrons/pixel/second), Nr = read noise (electrons rms/pixel).
References
- Angell, J.K., Global variation in total ozone and layer mean ozone: an update through 1981, J. Clim. And Appl. Meteorol., 22, 1611-1626, 1983.
- Bojkov R., V.E. Fioletov, Estimating the global ozone characteristics during the last 30 years, J. Geophys. Res., 100, 16537-16551, 1995.
- Wang, W.C., Climate implication of observed changes in ozone vertical distribution at middle and high latitudes in the northern hemisphere, Geophys. Res. Lett., 20, 1567-1570, 1993.
- Randel, W. J., R.S. Storalski, D.M. Cunnold, J.A.Logan, M.J.Newchurch, J.M. Zawodny, Trends in the vertical distribution of Ozone, Science, 285, 1689-1692, 1999.
- Noxon J.F., Stratospheric NO2, Observational Method and behaviour at mid latitude, Geophys. Res. Lett., 84, 5047-5065, 1979.
- Solomon, S. and R. Garcia, On the distribution of Nitrogen Dioxide in the High latitude stratosphere, J. Geophys. Res., 88, pp. 5229-5239, 1983.
- T.Wagner, C.Leue, K. Pfeilsticker and U. Platt: "Monitoring of stratospheric chlorine activation by global Ozone Monitoring Experiment (GOME) OclO measurements in the austral and boreal winters 1995 through 1999" J. Geophys. Res., 106, 4971-4986, 2001.
- Eisinger, M., and J.P. Burrows, Tropospheric sulfur dioxide observed by the ERS-2 GOME instrument, Geophys. Res. Letters 25, 4177-4180, 1998.
- Burrows, J.P., M. Weber, M. Buchwitz, V. Rozanov, A Ladstatter-Weissenmayer, A. Richter, R. De Beek, R. Hoogen, K. Bramstedt, K.W. Eichmann, M. Eisinger, and D. Perner, The Global Ozone Monitoring Experiment (GOME): Mission concept and first scientific results, J. Atmos Sci., 56, 151-175, 1999.
- Bovensmann H., J. P. Burrows, M. Buchwitz, J. Frerick, S. Noël, V. V. Rozanov, K. V. Chance, A. P. H. Goede, SCIAMACHY: mission objectives and measurements modes, J. Atmos. Sci., 56, 127-150, 1999.
- Bortoli, D., M.J. Costa, G. Giovanelli, A.M. Silva Vertical Column Of Atmospheric Compounds From Gome Data Analysis, Proc. EUMETSAT-"The 2002 EUMETSAT Meteorological Satellite Data Users' Conference", 669-676, 2003.
- Bortoli, D., F. Ravegnani, I. Kostadinov, G. Giovanelli, A. Petritoli and M.J. Costa, NO2, SO2 And Ozone Monitoring By Means Of GOME Data Analysis And Ground-Based Observations In The Mediterranean Area. Proc. EUMETSAT-"The 2001 EUMETSAT Meteorological Satellite Data Users' Conference", 293-300, 2001
- Velders G. J. M., C. Grainer, R. W. Portmann, K. Pfeilsticker, M. Weing, T. Wagner, U. Platt, A. Richter, J. P. Burrows, Global tropospheric NO2 column distributions: comparing three-dimensional model calculations with GOME measurements, J. Geophys. Res., 106, 12643-12660, 2001
- Lauer A., M. Dameris, A. Richter, J. P. Burrows, Tropospheric NO2 columns: a comparison between model and retrieved data from GOME measurements, Atmos. Chem. Phys., 2, 67-78, 2002
- Leue C., M. Weing, T. Wagner, O. Klimm, U. Platt, B. Jahne, Quantitative analysis of NOx emissions from Global Ozone Monitoring Experiment satellite image sequences, J. Geophys. Res., 106, 5493-5505, 2001
- Brune, W. H., J. G. Anderson and K. R. Chan, In situ observation of BrO over Antartica: ER-2 aircraft results from 54°S to 72°S latitude. J. Geophys. Res, 94, 16639-16647, 1989.
- Giovanelli, G., D. Bortoli, A. Petritoli, E. Castelli, I. Kostadinov, F. Ravegnani, G. Redaelli, C. M. Volk, U. Cortesi, G. Bianchini and B. Carli, Stratospheric minor gas distribution over the Antarctic Peninsula during the APE-GAIA campaign, Int J. Of Remote Sensing, in press, 2005
- Otten, C., F. Ferlemann, U. Platt, T. Wagner and K. Pfeilsicker. Ground based DOAS UV/Visible measurements at Kiruna (Sweden) during the SESAME winters 1993/94 and 1994/95. J. of Atmospheric Chemistry 30, 141-162, 1998.
- Sarkissian, A., G. Vaughan, H. K. Roscoe, L. M. Barlett, F. M. O'Connor, D. G. Drew, P. A. Huges, and D. M.Moore, Accuracy of measurements of total ozone by a SAOZ ground-based zenith sky visible spectrometer, J. Geophys. Res. 102, 1379-1390, 1997.
- Noxon J.F., Nitrogen dioxide in the stratosphere and troposphere measured by ground-based absorption spectroscopy. Science, 189, 547-549, 1975.
- Giovanelli G., P. Bonasoni, F. Evangelisti, O3 and NO2 Ground-based measurements at Terra Nova Bay, Antarctica. In: Italian research on Antarctic Atmosphere, M. Colacino, G. Giovanelli, L. Stefanutti, Eds, SIF Conference Proceedings, 27, 255-268, 1990.
- Sanders, R. W., S. Solomon, M.A.Carroll AND A. L. Schmeltekopf, Visible and Near-Ultraviolet spectroscopy at McMurdo station, Antarctica. 4. Overview and daily measurements of NO2, O3 and OClO during 1987. J. Geophys. Res., 94, 11381-11391,1989.
- Giovanelli,G. et al., Ozone ground-base measurements by the GASCOD near-UV and visibile DOAS system. in Proceedings of the Quadriennial Ozone Symposium 1992, NASA Confer. Pubblic. 3266, 707-711, Washington D.C., 1994.
- Petritoli, G. Giovanelli, P. Bonasoni, T. Colombo, F. Evangelisti, U.Bonafe, D. Bortoli, Iv. Kostadinov and F. Ravegnani. "Ground Based NO2 and O3 Analysis at Mt. Cimone Station during 1995-1996: a case study for spring 1995 NO2 concentration profile", in Spectroscopic Atmospheric Monitoring Techniques, K.Schafer, ed., Proc. EUROPTO 3867, 280-289, 1999.
- Sussmann R. and M. Buchwitz, Initial validation of ENVISAT/SCIAMACHY columnar CO by FTIR profile retrievals at the Ground-Truthing Station Zugspitze, Atmos. Chem. Phys., 5, 1497-1503, 2005
- Bracher A., M. Weber, K. Bramstedt, M. V. Konig, A. Richter, A. Rozanov, C. Savigny, and J. P. Burrows, 2002:Validation of ENVISAT trace gas data products by comparison with GOME/ERS-2 and other satellite sensors, ENVISAT Validation Workshop, ESA/ESRIN, Frascati,Italy, 9-13 December 2002, to be published by ESA Publications Division as Special Publication SP-531,
- Buchwitz, M., S. Noel, H. Bovensmann, and J. P. Burrows, Verification of SCIAMACHY Level 1 and 2 near-IR nadir data products by WFM-DOAS analysis, ENVISAT Validation Workshop, ESA/ESRIN, Frascati, Italy, 9-13 December 2002, to be published by ESA Publications Division as Special Publication SP-531 (on CD-ROM), 2002.
- Ahmad, S. P., P. F. Levelt, P. K. Bhartia, E. Hilsenrath, G. W. Leppelmeier, and J. E. Johnson, "Atmospheric Products from the Ozone Monitoring Instrument (OMI)", Proceedings of SPIE conference on Earth Observing Systems VIII, San Diego, California, Aug 3-8, 2003.
- Bhartia, P. K., and C. W. Wellemeyer, "OMI TOMS-V8 Total O3 Algorithm", Algorithm Theoretical Baseline Document: OMI Ozone Products, P. K. Bhartia (ed.), vol. II, ATBD-OMI-02, version 2.0, Aug. 2002.
- Boersma, F., E. Bucsela, E. Brinksma, and J. F. Gleason, "NO2", Algorithm Theoretical Baseline Document: OMI Trace Gas Algorithms, K.Chance (ed.), vol. IV, ATBD-OMI-04, version 2.0, Aug. 2002.
- Chance,K., T. P. Kurosu, and L. S. Rothman, "HCHO", "OClO", "BrO", Algorithm Theoretical Baseline Document: OMI Trace Gas Algorithms, K. Chance (ed.), vol. IV, ATBD-OMI-04, version 2.0, Aug. 2002.
- Bortoli, D., F. Ravegnani, Iv. Kostadinov, G. Giovanelli, A. Petritoli, F.Calzolari, MJ. Costa, A.M. Silva, S. Beirle, T. Wagner, M. Wenig and U. Platt, Stratospheric Nitrogen Dioxide In Antarctic Regions From Ground Based And Satellite Observation During 2001, Proc. SPIE, 4882, 304-313, 2003.
- Bortoli, D., G. Giovanelli, F. Ravegnani, I. Kostadinov, A. Petritoli, T.Catalbiano and J.P. Burrows, GOME Data Analysis And Ground Based In The Mediterranean Area During Etna Volcano Activity, ERS-ENVISAT Symposium "Looking down to Earth in the New Millenium" SP-461, ESA Publication Division, 2000.
- Lambert, J.-C., M. Van Roozendael, P.C. Simon, J.-P. Pommereau, F. Goutail, J.F. Gleason, S.B. Andersen, D.W. Arlander, N.A. Bui Van, H. Claude, J. de La Noë, M. De Mazière, V. Dorokhov, P. Eriksen, A. Green, K. Karlsen Tørnkvist, B.A. Kåstad Høiskar, E. Kyrö, J. Leveau, M.-F. Merienne, G. Milinevsky, H.K. Roscoe, A. Sarkissian, J.D. Shanklin, J. Staehelin, C. Wahlstr¢m Tellefsen, and G. Vaughan, Combined characterisation of GOME and TOMS total ozone measurements from space using ground-based observations from the NDSC, Adv. Space Res., 26, 1931-1940, 2000.
- Martin, R.V., D.D. Parrish, T.B. Ryerson, D.K. Nicks Jr., K. Chance, T.P. Kurosu, A. Fried, B.P. Wert, D.J. Jacob, and E.D. Sturges, Evaluation of GOME satellite measurements of tropospheric NO2 and HCHO using regional data from aircraft campaigns in the southeastern United States, J. Geophys. Res. 109, D24307, 2004.
- Wallace J. M., P. V. Hobbs, Atmospheric Science, an introductory survey, Academic Press, San Diego, 1977.
- Brasseurs G. P., J. J. Orlando, G. S. Tyndall, eds., Atmospheric chemistry and global change, Oxford University Press, New York, 1999
- Finlayson-Pitts B.J. e Pitts J.N.Jr., Atmospheric chemistry: fundamentals and experimentale techniques. J.Wiley & Sons Ed., Wiley Interscience Pub., New York, 1986.
- Chapman S., On ozone and atomic oxygen in the upper atmosphere, Phil. Mag., 10, 369, 1930
- Brasseur G. e Solomon S., Aeronomy of the middle atmosphere. D.Reidel Publishing Company, Dordrecht, Holland, 1986.
- Rowland, F. S., Nobel Lecture in Chemistry Ed. Bo G Malmström, Chalmers University of Technology; Göteborg University, 273-296, 1997
- Platt, U., "Differential Optical Absorption Spectroscopy (DOAS)" in Air Monitoring by spectroscopic Techniques, Ed W. Sigrist, Chemical Analysis Series, 127, 22-85, 1994
- SPIE - The International Society of Optical Engineering, Introduction. In Measurement of atmospheric gases, 1433, 1991.
- Edner H., Ragnarson P., Spännare S. e Svanberg S., Differential optical absorption spectroscopy (DOAS) system for urban atmospheric pollution monitoring. Applied Optics, 32, 3, 327-333, 1993.
- Solomon, S., A. Schmeltekopf and R. Sanders, , On the interpretation of zenith sky absorption measurements. J. Geophys. Res, 92, 8311-8319, 1987.
- Plane J.M.C. e Nien C., Differential optical absorption spectrometer for measuring atmospheric trace gases. Rev. Sci. Instrum., 63(3), 1867-1876, 1992.
- Platt U., Perner D., Schroeder J., Kessler C. e Toennisen A., The diurnal variation of NO3. J. Geophys. Res., 86, 965-970, 1981.
- Platt, U., and D. Perner, Direct measurement of atmospheric CH2O, HNO2, O3, and SO2 by differential absorption in the near UV, J. Geophys. Res., 85, p. 7453, 1980.
- Platt U., Rateije M., Junkermann W., Rudolph J. e Ehhalt D.H., New tropospheric OH measurements. J. Geophys. Res., 93, 5159-5166, 1988.
- Stevens R.K. e Vossler T.L., DOAS urban pollution measurements. In Proc. Measurement of atmospheric gases, H.I.Schiff Ed., SPIE Pub., 1433, 25-35, 1991.
- Perliski, L. and S. Solomon, On the evaluation of air mass factor for near-UV and visible absorption spectroscopy. J. Geophys. Res., 98, 10363-10374, 1993.
- Slusser J., K. Hammond, A. Kylling, K. Stamnes, L. Perliski, A. Dahlback, D. Anderson, R. De Majistre, Comparison of air mass computations, J. Geophys. Res., 101, 9,315-9,321, 1996
- Petritoli A., "Distribuzioni verticali di gas in traccia in atmosfera ottenute con metodi di inversione applicati a misure di quantità colonnari", Degree Thesis, 1998.
- Sarkissian A., H. K. Roscoe, D. Fish, P. Pommereau, M. Van Roozendael, M. Gil, H. B. Chen, P. Wang, J. Lenoble, Ozone and NO2 air-mass factor for zenith-sky spectrometres: Intercomparison of calculation with different radiative transfer models. Geophys. Res. Lett., 22, 1113-1116, 1995.
- Sarkissian A., H. K. Roscoe, D. Fish, (a): Ozone measurements by zenith-sky spectrometres: an evaluation of errors in air-mass factors calculated by radiative transfer models, J. Quant. Spectrosc. Radiat. Transfer, 54, 471-480, 1995.
- Kondratyev K. Ya., Radiation in the atmosphere. Academic Press, New York and London, 1969.
- Junge C. E., Air chemistry and radioactivity, Int. Geophys. Ser., 4, Academic Press, New York and London, 1963.
- Goodman, J. W.: Statistical Optics. New York: Wiley, 1985
- Kylling A., K. Stamnes, S. C. Tsay, A reliable and efficient two-stream algorithm for radiative transfer; Documentation of accurancy in realistic layered media, J.Atmos.Chem., 21,115-150, 1995
- Anderson G. P., S. A. Clough, F. X. Kneizys, J. H. Chetwynd, E. P. Shettle, AFGL Atmospheric Constituent Profile (0-120Km). AFGL-TR-86-0110, AFGL (OPI), Hanscom AFB, MA 01736, 1987.
- Meinel A. & M., Sunset, twilights, and evening skies. Cambridge University Press, 1983.
- Kasten F., A new table and approximation formula for the relative optical air mass, Arch. F. Met. Geophys. Bioklimat., Ser. B, Bd. 14. Heft. 2, 206, 1966.
- Evangelisti, F., A. Baroncelli, P. Bonasoni, G. Giovanelli AND F. Ravegnani, Differential optical absorption spectrometer for measurement of tropospheric pollutants. Applied Optics, 34, 2737-2744, 1995.
- Giovannelli G., P. Bonasoni, F. Evangelisti, O3 and NO2 Ground-based measurements at Terra Nova Bay, Antartica. In: Italian research on Antartic Atmosphere, M. Colacino, G. Giovanelli, L. Stefanutti, Eds, SIF Conference Proceedings, 27, 255-268, 1990.
- Giovannelli G., P. Bonasoni, F. Evangelisti, Determination of gas column amount by solar zenith radiation measurements. In: Italian research on Antartic Atmosphere, M. Colacino, G. Giovanelli, L. Stefanutti, Eds, SIF Conference Proceedings, 35, 453-467, 1992.
- Bortoli, D., F. Ravegnani, G. Giovanelli, Iv Kostadinov, A. Petritoli and G. Trivellone, Continuous Observation Of NO2 And O3 Total Columns At Terra Nova Bat Station, Antarctica, Proc. SIF, 69, 363-374, 2000
- Roscoe H. K., P. V. Johnston, M. V. Roozendael, A. Richter, A. Sarkissian, J. Roscoe, K: E. Preston, J.-C. Lambert, C. Hermans, W. Decuyper, S. Dzienus, T. Winterrath, J. Burrows, F. Goutail, J.-P. Pommereau, E. D'Almeida, J. Hottier, C. Courreul, R. Didier, I. Pundt, L. M. Bartlett, C. T. McElroy, J. E. Kerr, A. Elokhov, G. Giovanelli, F. Ravegnani, M. Premuda, I. Kostadinov, F. Erle, T. Wagner, K. Pfeilsticker, M. Kenntner, L. C. Marquard, M. Gil, O. Puentedura, M. Yela, D. W. Arlander, B. A. Kastad Hoiskar, C. W. Tellefsen, K. Karlsen Tornvist, B. Heese, R. L Jones, S. R. Aliwell, R. A. Freshwater, Slant Column measurements of O3 and NO2 During the NDSC intercomparison of Zenith-Sky UV-Visible Spectrometers in June 1996, J. Atmos. Chem., 32, 281-314, 1999
- Fish, D. J., Measurements of stratospheric composition using ultraviolet and visible spectroscopy, Ph. D. Thesis, University of Cambridge, 1994.
- Press W.H., Flannery B.P., Teukolsky S.A., Vetterling W. T. Numerical Recipes - The Art of Scientific Computing, Cambridge University Press, Cambridge, 1989.
- Harder J. W., Brault J. W., Johnston P.V. and Mount G.H., Temperature dependent NO2 cross section at high spectral resolution, J. Geophys. Res. 102, 3861,3879, 1997.
- Sanders R. W., Improved analysis of atmospheric absorption spectra by including the temperature dependencies of NO2, J. Geophys. Res. 101, 20945,20952, 1996.
- Bortoli, D., G. Giovanelli, F. Ravegnani, I. Kostadinov and A. Petritoli, Stratospheric Nitrogen Dioxide in the Antarctic, Int J. Of Remote Sensing, 26, 3395-3412, 2005
- Burrows,J.P., A. Dehn, B. Deters, S. Himmelmann, A. Richter, S. Voigt, and J. Orphal: Atmospheric Remote-Sensing Reference Data from GOME: 1. Temperature-Dependent Absorption Cross Sections of NO2 in the 231-794 nm Range, Journal of Quantitative Spectroscopy and Radiative Transfer 60, 1025-1031, 1998.
- Burrows, J.P. William R.: CART Regression Models for Predicting UV Radiation at the Ground in the Presence of Cloud and Other Environmental Factors. Journal of Applied Meteorology, 36, 5, 531-544, 1997.
- Chance, K., P.I. Palmer, R.J.D. Spurr, R.V. Martin, T.P. Kurosu, and D.J. Jacob, Satellite Observations of Formaldehyde over North America from GOME, Geophys. Res. Lett., 27, 3461-3464, 2000.
- Chance, K., Analysis of BrO Measurements from the Global Ozone Monitoring Experiment, Geophys. Res. Lett., 25, 3335-3338, 1998
- Corlett, Gary K., Monks, Paul S., A Comparison of Total Column Ozone Values Derived from the Global Ozone Monitoring Experiment (GOME), the Tiros Operational Vertical Sounder (TOVS), and the Total Ozone Mapping Spectrometer (TOMS), Journal of the Atmospheric Sciences: 58, 9, 1103-1116, 2001.
- Weber, M., K.-U. Eichmann, F. Wittrock, K. Bramstedt, L. Hild, A. Richter, J.P. Burrows, and R. Muller, The cold Arctic winter 1995/96 as observed by the Global Ozone Monitoring experiment GOME and HALOE: Tropospheric wave activity and chemical ozone loss, Q. J. Roy. Meteor. Soc. 128, 1293-1319, 2002
- Koelemeijer, R. B. A.; de Haan, J. F.; Stammes, P., A database of spectral surface reflectivity in the range 335-772 nm derived from 5.5 years of GOME observations, J. Geophys. Res. 108 , 2003
- Kondo, Y., W. A. Matthews, S. Solomon, M. Koike, M. Hayashi, K. Yamazaki, H. Nakajima, K. Tsukui, Ground based measurements of column amounts of NO2 over Syowa station, Antarctica. J. Geophys. Res., 99, 14535-14548, 1994.
- Juckes M.N. and M.E. McIntyre, A high-resolution one-layer model of breaking planetary waves in the stratosphere. Nature, 328, 590-596, 1987.
- Herman, J. R., P. K. Bhartia, O. Torres, C. Hsu, C. Seftor, and E. Celarier, Global distributions of UV-absorbing aerosols from Nimbus 7/TOMS data, J. Geophys. Res., 102, 16,911-16,922, 1997.
- Immler, F. and O. Schrems, Vertical profiles, optical and microphysical properties of Saharan dust layers determined by a ship-borne lidar, Atmos. Chem. Phys., 3, 1353-1364, 2003
- Rodger C. D., Characterization and error analysis of profiles retrieved from remote sounding measurements, J. Geophys. Res., 95, 5,587-5,595, 1990.
